
A stealth pattern every smart trader watches—but few truly understand
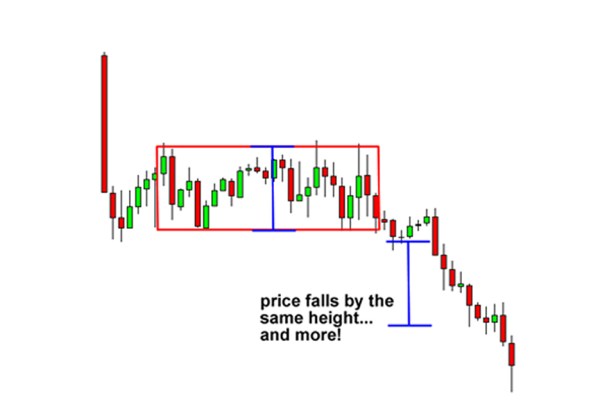
📌 Why Rectangle Patterns Deserve More Respect
Most traders chase breakouts, headlines, or indicator signals.
Smart money waits patiently inside rectangles.
Rectangle patterns are one of the most underestimated structures in technical analysis. They don’t look exciting. They don’t trend fast. They don’t grab attention on social media.
Yet…
Some of the biggest moves in market history were built quietly inside rectangles.
In this article, you’ll learn:
- Why rectangle patterns form
- How institutions use them for accumulation and distribution
- How rectangles compress energy before explosive moves
- Trading strategies for bullish and bearish rectangles

🔍 What Is a Rectangle Pattern?
A rectangle pattern forms when price moves sideways between:
- Horizontal resistance (top boundary)
- Horizontal support (bottom boundary)
This creates a tight price box where:
- Buyers step in at support
- Sellers appear at resistance
- Neither side wins—yet
➡️ The market is coiling, not resting.
🧠 The Psychology Behind Rectangles
Rectangles are zones of agreement.
- Bulls think price is cheap at support
- Bears think price is expensive at resistance
- Institutions quietly accumulate or distribute positions
- Retail traders get bored and leave
This boredom is critical.
📉 Low emotion + low volatility = fuel building up
When the rectangle finally breaks…
💥 The move is often fast, violent, and unforgiving

🏦 Why Institutions Love Rectangle Patterns
Big players cannot enter or exit positions instantly.
They need:
- Time
- Liquidity
- Predictable price zones
Rectangles provide all three.
Institutional behavior inside rectangles:
- Buy gradually near support
- Sell gradually near resistance
- Shake out impatient traders
- Absorb liquidity silently
By the time price breaks out—
📈 Most of the real position is already built
📊 Bullish Rectangle: Silent Accumulation Before Explosion

Characteristics:
- Occurs after an uptrend
- Price consolidates sideways
- Support holds consistently
- Volume often dries up
What’s really happening?
- Weak hands exit
- Strong hands absorb supply
- Momentum is paused—not reversed
Breakout behavior:
- Sharp price expansion
- Sudden volume spike
- Little time to react
➡️ This is why rectangle breakouts often gap up or trend relentlessly
📉 Bearish Rectangle: Quiet Distribution Before Breakdown

Characteristics:
- Appears after a downtrend
- Price fails to recover
- Resistance caps every rally
Inside the rectangle:
- Institutions distribute positions
- Retail traders hope for reversal
- Support looks strong—until it isn’t
Breakdown effect:
- Stop-loss cascade
- Panic selling
- Rapid price collapse
➡️ The rectangle didn’t cause the fall—it prepared it.
🔥 Why Rectangle Breakouts Are So Powerful
Rectangles create volatility compression.
Think of it like:
- A spring being compressed
- Pressure building quietly
- Energy storing with each failed breakout
When price finally escapes:
🚀 The move feeds on trapped traders, stop-losses, and momentum chasers
This is why rectangle breakouts often:
- Travel farther than expected
- Ignore indicators
- Don’t give pullbacks
🎯 How to Trade Rectangle Patterns (Smart Way)
✅ Strategy 1: Breakout with Confirmation
- Wait for close above resistance / below support
- Look for volume expansion
- Enter on retest or continuation
✅ Strategy 2: Range Trading (Advanced)
- Buy near support
- Sell near resistance
- Tight stop-loss outside the box
⚠️ Best for experienced traders only
✅ Strategy 3: Measured Move Target
- Measure rectangle height
- Project it from breakout point
- Use partial profit booking
🚫 Common Mistakes Traders Make
❌ Entering too early inside the box
❌ Assuming every rectangle will break up
❌ Ignoring higher timeframe context
❌ Overtrading small candles
❌ Using tight stop-losses inside compression
Remember:
The rectangle is preparation, not the signal
🧩 Rectangles Across Timeframes
- Daily charts → Swing & positional trades
- Weekly charts → Multi-month breakouts
- Intraday charts → Momentum scalps
📌 The higher the timeframe, the bigger the eventual move
🧠 Final Thought: The Market Whispers Before It Screams
Rectangles are the market whispering.
No news.
No hype.
No excitement.
But inside that silence—
📦 Positions are being built
📦 Liquidity is being absorbed
📦 A massive move is loading
By the time the crowd notices—
🚀 The rectangle has already done its job
Still struggling with inconsistent trading decisions?
The 48-Hour Trading Reset is a practical 213-page framework for controlling avoidable losses, rebuilding discipline, and creating a simple, repeatable trading process.
Educational use only. Trading involves risk and losses can occur.
📈 Want More Silent Market Secrets?
Follow for:
- Smart money patterns
- Failed breakout psychology
- High-probability structures
Because the biggest moves are never loud at the start.