
A Complete, SEO-Optimized & Google Discover-Friendly Trading Guide
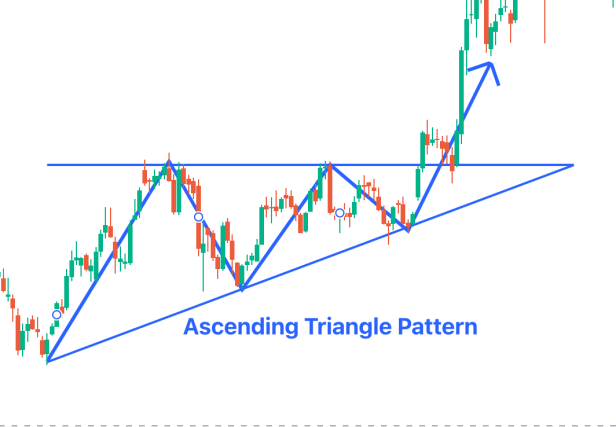
The Ascending Triangle pattern is one of the most widely used bullish continuation chart patterns across stocks, indices, crypto, and forex markets. When traded correctly, it offers clear entry points, defined risk, and high reward potential—but it is also one of the most frequently misread and mistimed patterns, trapping traders who treat it mechanically.
In this in-depth guide, you’ll learn how to identify, confirm, and trade the Ascending Triangle pattern—and just as importantly, when it’s a genuine breakout versus a trap—using multiple proven strategies from beginner-friendly to advanced professional setups.
What Is the Ascending Triangle Pattern?
An Ascending Triangle is a bullish chart pattern formed when:
- Price makes higher lows (rising trendline)
- Price repeatedly hits a horizontal resistance
- Buying pressure increases over time
- Breakout usually occurs above resistance
This pattern reflects accumulation by strong buyers who absorb selling pressure at resistance until price finally explodes upward.
Structure of an Ascending Triangle

Key Components
- Horizontal Resistance Line
- Flat ceiling where price struggles to break
- Rising Support Line
- Higher lows show aggressive buying
- Converging Price Action
- Price compresses before breakout
- Volume Contraction
- Volume dries up inside the triangle
- Volume Expansion on Breakout
- Confirms strength of move
Why Ascending Triangle Is a Bullish Pattern
- Buyers are willing to pay higher prices
- Sellers fail to push price lower
- Supply at resistance gets absorbed
- Breakout often leads to strong momentum moves
This makes it ideal for trend continuation strategies—but popularity has a downside, covered next.
Breakout or Trap? Why So Many Ascending Triangles Fail
Ascending triangles are popular precisely because they’re easy to spot, easy to explain, and easy to trade mechanically. And that popularity is exactly why they often fail.
Markets move based on liquidity, not patterns. When too many traders expect the same breakout, stop-losses cluster below the rising trendline and buy orders pile up above resistance—creating an opportunity for smart money to hunt that liquidity. The result is a breakout that looks perfect, then collapses.
Retail Trader Thinking vs Smart Money Thinking
Retail traders typically think: “Higher lows = strong demand,” “flat resistance will break,” “this is a textbook setup.”
Smart money typically thinks: “Where are the stops?” “Where is liquidity concentrated?” “How can we induce breakout buying?” Once breakout traders enter aggressively, institutions can sell into that pressure, causing a sharp reversal that traps late buyers.
Four Reasons Breakouts Fail
- Rising lows don’t always mean strength – they can reflect short covering or simply weak sellers stepping aside, not aggressive buying. Without strong volume, rising lows are meaningless.
- Volume is often deceptive – a brief volume spike with no follow-through, where price stalls right after breaking resistance, is a sign of distribution, not accumulation.
- Higher timeframe resistance gets ignored – a triangle forming below major weekly resistance or inside a larger range cannot override higher-timeframe control.
- Late breakouts near the apex are the most dangerous – the closer price gets to the triangle’s apex, the more risk increases and breakout power decreases. The market is compressing, not exploding.
When Ascending Triangles Actually Work
Not all ascending triangles are traps. High-probability conditions include:
✔ Strong higher-timeframe uptrend
✔ Breakout aligns with market structure
✔ Volume expands before, not just during the breakout
✔ Breakout retests and holds above resistance
✔ Broader market sentiment is bullish
In these cases, the pattern acts as genuine continuation, not manipulation.
Genuine Breakout vs Bull Trap
| Feature | Genuine Breakout | Bull Trap |
|---|---|---|
| Volume | Builds gradually | Sudden spike |
| Retest | Holds above resistance | Fails quickly |
| Follow-through | Strong trend continuation | Sharp reversal |
| Context | Trending market | Range or resistance |
| Candle closes | Strong bodies | Long wicks |
📌 Bottom line: an ascending triangle is neither bullish nor bearish by default—it’s a liquidity structure and a test of trader patience. Those who trade it mechanically get trapped. Those who trade it with context get rewarded.
Where Ascending Triangles Work Best
- 📈 Uptrending markets
- 📊 Stocks near all-time highs
- ⏱ Intraday, swing, and positional trades
- 🪙 Crypto & Forex breakouts
- 📉 Low volatility → high expansion zones
Step-by-Step: How to Identify a Perfect Ascending Triangle
- Existing uptrend or bullish bias
- At least 2 equal highs at resistance
- At least 2 higher lows
- Price compressing toward apex
- Volume declining inside the pattern
Pro Tip: The more times resistance is tested, the stronger the breakout.
Trading Strategies for Ascending Triangle Pattern
1. Classic Breakout Strategy (Most Popular)
Entry
- Buy when price closes above resistance
- Preferably on high volume
Stop Loss
- Below the last higher low
- Or below the breakout candle low
Target
- Measure height of triangle
- Add it to breakout level
📌 Risk-Reward: 1:2 or higher
2. Retest Breakout Strategy (High Accuracy)
Entry
- Wait for breakout
- Buy on pullback to resistance (now support), and only enter if buyers actively defend the level—this filters most fake breakouts
Why It Works
- Filters false breakouts
- Institutions often enter on retests
Stop Loss
- Below retest support
Target
- Same as classic measured move
3. Early Entry Near Rising Trendline (Aggressive)
Entry
- Buy near rising support
- Before breakout occurs
Best For
- Traders with tight risk control
- Strong bullish market context
Stop Loss
- Below trendline support
Target
- Breakout + measured move
⚠️ Higher risk, higher reward
4. Ascending Triangle + Volume Strategy
Rules
- Volume must decline inside triangle
- Volume must expand on breakout, ideally rising steadily through the consolidation rather than spiking only on the breakout candle
Entry
- Breakout candle with volume > 20-day average
Stop Loss
- Below breakout candle midpoint
Target
- Measured height of triangle
5. Ascending Triangle + RSI Confirmation
Confirmation Rules
- RSI stays above 40–50 zone
- RSI breaks above 60 during breakout
Entry
- Breakout candle with RSI strength
Benefit
- Filters weak breakouts
6. Ascending Triangle + Moving Averages
Setup
- Price above 20 EMA & 50 EMA
- EMAs sloping upward
Entry
- Breakout above resistance
Stop Loss
- Below 20 EMA
Target
- Triangle height or previous swing high extension
7. Intraday Ascending Triangle Strategy
Timeframes
- 5-min, 15-min charts
Best Time
- First 90 minutes
- Post-lunch breakout
Entry
- Breakout with volume spike
Stop Loss
- Tight SL below consolidation
Target
- 1:1.5 or 1:2 RR
8. Ascending Triangle in Strong Trend Stocks
Best Stocks
- Near 52-week high
- Strong earnings or news backdrop
Strategy
- Buy breakout
- Trail stop using higher lows
9. False Breakout Protection Strategy
Rules
- Avoid breakouts with low volume
- Avoid breakouts near market close
Confirmation
- Wait for candle close above resistance
10. Multi-Timeframe Ascending Triangle Strategy
Process
- Identify triangle on daily chart
- Enter on hourly or 15-min breakout
Benefit
- Precision entries
- Smaller stop losses
Common Mistakes Traders Make
❌ Entering before structure is complete
❌ Ignoring volume
❌ Trading against overall market trend
❌ Setting unrealistic targets
❌ No stop loss discipline
❌ Blindly buying every ascending triangle without checking context
❌ Entering near the apex where risk is highest
Ascending Triangle vs Symmetrical Triangle
| Feature | Ascending Triangle | Symmetrical Triangle |
|---|---|---|
| Bias | Bullish | Neutral |
| Support | Rising | Slanted |
| Resistance | Horizontal | Slanted |
| Reliability | High in uptrend | Depends on breakout |
Best Indicators to Use With Ascending Triangle
- Volume
- RSI
- VWAP (Intraday)
- 20 & 50 EMA
- Market Index Trend
Risk Management Rules (Very Important)
- Never risk more than 1–2% per trade
- Trade only confirmed breakouts
- Avoid trading during major news events
- Always define SL before entry
Is Ascending Triangle 100% Accurate?
No pattern is perfect.
- Win rate: 60–75% when traded correctly
- Best results when combined with:
- Trend
- Volume
- Market sentiment
Final Thoughts: Should You Trade Ascending Triangle?
Yes—if you trade it with discipline and context, not blind pattern-matching.
The Ascending Triangle is:
- Beginner-friendly
- Easy to identify
- Offers excellent risk-reward
- Works across timeframes & assets
But it also punishes traders who treat it as guaranteed. Master both the setup and the failure modes, and you’ll add a powerful, risk-aware bullish weapon to your trading arsenal.