
The Symmetrical Triangle Pattern is one of the most powerful and widely traded continuation patterns in technical analysis. It reflects a period of market indecision, where buyers and sellers compress price into a tightening range—often leading to an explosive breakout.
In this in-depth guide, you’ll learn how to identify, trade, and profit from the symmetrical triangle using multiple proven trading strategies, real-world logic, and risk-controlled setups—optimized for stocks, crypto, forex, and indices.

What Is the Symmetrical Triangle Pattern?
A Symmetrical Triangle forms when:
- Price makes lower highs
- Price makes higher lows
- Two converging trendlines slope toward each other
- Volume gradually contracts
Unlike ascending or descending triangles, direction is neutral—the breakout can occur up or down.
📌 Key Insight:
The pattern represents balance → pressure → expansion
Psychology Behind the Pattern
- Buyers are no longer aggressive enough to push higher highs
- Sellers are unable to force lower lows
- Stops accumulate on both sides
- Breakout triggers panic + momentum + volume spike
This makes the symmetrical triangle a volatility compression pattern, similar to a coiled spring.

How to Identify a Valid Symmetrical Triangle
✅ At least 2 lower highs & 2 higher lows
✅ Trendlines must converge clearly
✅ Pattern forms over 20–200 candles
✅ Volume declines during formation
❌ Avoid patterns forming after sideways markets
Types of Symmetrical Triangle Breakouts
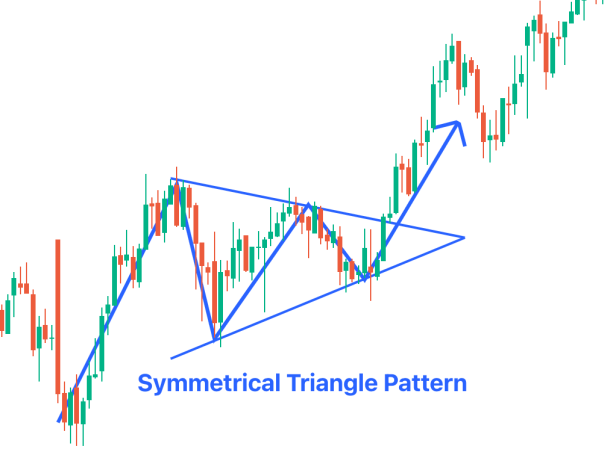

1. Bullish Breakout
- Break above upper trendline
- Volume expansion
- Continuation of prior uptrend
2. Bearish Breakout
- Break below lower trendline
- Strong red candle
- Continuation of prior downtrend
Best Trading Strategies for Symmetrical Triangle
Strategy 1: Classic Breakout Trade (Beginner Friendly)
Entry
- Buy above upper trendline (bullish)
- Sell below lower trendline (bearish)
Stop Loss
- Below last swing low (bullish)
- Above last swing high (bearish)
Target
- Measure triangle height
- Project from breakout point
📈 Risk-Reward: 1:2 or better
Strategy 2: Breakout + Retest Strategy (High Accuracy)
Entry
- Wait for breakout
- Enter on pullback to broken trendline
Why It Works
- Filters fake breakouts
- Institutions often retest before continuation
Stop Loss
- Inside triangle
Target
- Same as measured move
✅ Best for swing traders
Strategy 3: Volume Confirmation Strategy
Rules
- Breakout candle must have:
- Volume above 20-period average
- Strong body (no long wicks)
Avoid
- Breakouts with low volume
- Thin market hours
📌 This strategy drastically reduces false signals.
Strategy 4: Symmetrical Triangle + RSI
Bullish Setup
- RSI above 50
- Bullish divergence near apex
- Breakout upward
Bearish Setup
- RSI below 50
- Bearish divergence
- Breakdown downward
🎯 Adds momentum confirmation
Strategy 5: Moving Average Confluence Strategy
Setup
- 20 EMA & 50 EMA compress inside triangle
Trade
- Enter in direction of EMA crossover after breakout
Stop Loss
- Below EMAs (bullish)
- Above EMAs (bearish)
📊 Ideal for index & crypto trading
Strategy 6: Trend Continuation Triangle Strategy
Trade only in direction of higher-timeframe trend.
Example
- Daily chart in uptrend
- 1H symmetrical triangle
- Trade only bullish breakouts
🔒 Reduces whipsaws significantly
Strategy 7: Aggressive Early Entry (Advanced)
Entry
- Near triangle support (bullish bias)
- Near triangle resistance (bearish bias)
Stop Loss
- Tight, outside trendline
⚠️ Higher risk, higher reward
Best for experienced traders
Strategy 8: Options Trading Strategy
Bullish
- Buy Call after breakout
- Bull Call Spread for safety
Bearish
- Buy Put after breakdown
- Bear Put Spread
⏳ Best when triangle forms near expiry
Common Mistakes Traders Make
❌ Trading before breakout
❌ Ignoring volume
❌ Entering near apex (low reward)
❌ Not checking higher timeframe trend
❌ Using tight stop losses during volatility expansion
Best Timeframes to Trade
- Scalping: 5m – 15m
- Intraday: 30m – 1H
- Swing Trading: 4H – Daily
- Investing: Weekly (rare but powerful)
Symmetrical Triangle vs Other Triangle Patterns
| Pattern | Bias |
|---|---|
| Symmetrical Triangle | Neutral |
| Ascending Triangle | Bullish |
| Descending Triangle | Bearish |
When NOT to Trade Symmetrical Triangle
🚫 During low-liquidity sessions
🚫 Just before major news/events
🚫 If volume doesn’t expand on breakout
🚫 If triangle is too small or too wide
Pro Trader Tips
💡 Breakouts often happen at 60–75% of triangle length
💡 Combine with VWAP / Support-Resistance
💡 Use partial profit booking
💡 Trail stop using EMA or ATR
Still struggling with inconsistent trading decisions?
The 48-Hour Trading Reset is a practical 213-page framework for controlling avoidable losses, rebuilding discipline, and creating a simple, repeatable trading process.
Educational use only. Trading involves risk and losses can occur.
Final Thoughts
The Symmetrical Triangle Pattern is a high-probability setup when traded with:
- Clear structure
- Volume confirmation
- Trend alignment
- Risk discipline
Mastering this pattern can significantly improve your win rate, consistency, and confidence across all markets.